Should Current Market Volatility Merit a Review of how you are Trading?
13 March 2020
Volatility Revisited
Volatility is a measure of the range of price movement over a defined period on a specific timeframe on which any calculation is performed. It may increase or decrease dependent on market conditions and aims to provide the trader with an indication as to whether the range price movement in subsequent candles/bar is likely to be large or small.
Of course, as with the majority of indicators it is a lagging measure, in that it is calculated on previous candles and therefore this should be recognised by the individual trader when considering incorporating it into their own decision-making processes relating to entry and exit.
One of the most used volatility indicators is the Average True Range (ATR), and we have discussed this previously both in past articles and Inner Circle webinars sessions. As the basis of its calculation, it uses (as a default setting) the last 14 bars of price ranges and plots an average of this on a chart.
Common uses include (along with other potential criteria):
- Setting of risk management stop
- Potential ‘trail stop’ and ‘profit taking’ strategies
- Use in “breakout” entry strategies
Current Market Volatility
A combination of concerns re. the continuing spread of Coronavirus and Oil pricing wars over the last fortnight, have created prolonged volatility levels not seen since the Global Financial Crisis (GFC) in 2008. Although the root causes are dramatically different, price ranges have definite similarities.
Such volatility can be seen across all time-frames and across all financial instruments, as market sentiment is flung one way and then the other, as continuing updates hit the newswires.
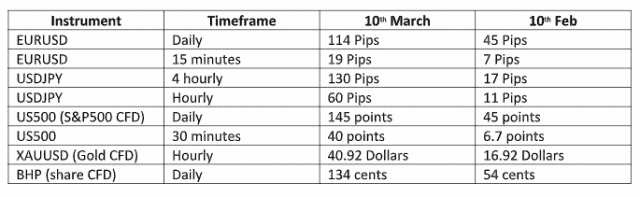
To give context here are a few examples (using the ATR) comparing 10th March with the previous month:
Potential Considerations for your Trading
One of the first lessons that it is important to recognise as traders is that, we are trading “risk”. It is price changes that create opportunity to profit and loss account capital. Appropriate management of this is CRITICAL in all trading situations, irrespective of market volatility.
There is no doubt however that higher (and increasing) volatility means that the likelihood of a significant price move away from the current price of any instrument is increased in a shorter period of time than would be considered in the market norm (as illustrated by the figure in the table above).
As an individual investor, as part of your chosen risk management, there are some potential considerations that this heightened volatility that may be worth examining.
(Note: We are not aiming to be predictive rather, offer suggestion as to questions you could ask of your current trading actions).
- Should I be trading at all in current market conditions?
- As current market movements are fundamentally headline-driven and there is far less predictability than for example general economic data releases about the timing of such headlines hitting the newswires, does this merit reviewing the time-frames you would normally consider?
- If you are not currently using a volatility indicator (such as an ATR) as part of your decision making, is it worth reviewing your criteria for entry/exit to incorporate this?
- Remembering that volatility is NOT considered to be a predictor of price direction to the entry or exit criteria you use.
- Do I reduce the tolerable risk limit I apply to any trade i.e. review the % of account capital you are prepared to risk on any trade (e.g. reduce from 2% to 1%)?
- If you are using ATR for decision making re. breakouts, should you consider a review of how you are using this e.g. if you normally use a price close to 0.5 ATR above a resistance as part of your reason for entry into a long trade, would 1xATR above reduce the chances of “false breakouts”?
There are three things we want you to take away from this article:
- The recognition that extraordinary market circumstances may merit a review as to how you may normally trade (including potentially giving yourself permission to step back from trading) and be in no doubt that these circumstances ARE extraordinary.
- As always, the trading choices you make mean that YOU are responsible for your trading results not the market irrespective of underlying market conditions.
- Make copious journal records of what is happening and what you are doing. There will be times in the future when similar market conditions occur. As the majority of you, we are guessing and keen to view your trading as something you can do for a lifetime, treat this as an invaluable learning opportunity for what may work (or otherwise) for you next time it happens.
Disclaimer: Articles are from Encrypt Investment analysts and contributors and are based on their independent analysis or personal experiences. Views, opinions or trading styles expressed are their own, and should not be taken as either representative of or shared by Encrypt Investment. Advice, if any, is of a ‘general’ nature and not based on your personal objectives, financial situation or needs. Consider how appropriate the advice, if any, is to your objectives, financial situation and needs, before acting on the advice. If the advice relates to acquiring a particular financial product, you should obtain and consider the Product Disclosure Statement (PDS) and Financial Services Guide (FSG) for that product before making any decisions.
Next Article
Gold Is Being Liquidated
Liquidity Crisis High levels of liquidity happen when there is both supply and demand for an asset, meaning transactions can take place easily. A market is considered to be liquid if it can absorb liquidity trades with significant changes in price. A liquidity crisis is, therefore, an acute shortage or drying up of liquidity. In simple terms, it...
Previous Article
Top 5 Daily Habits of Experienced Traders
Success leaves clues, and over the years as an educator and coach, I can confidently say that there are several things that traders who achieve po...